, 1 min read
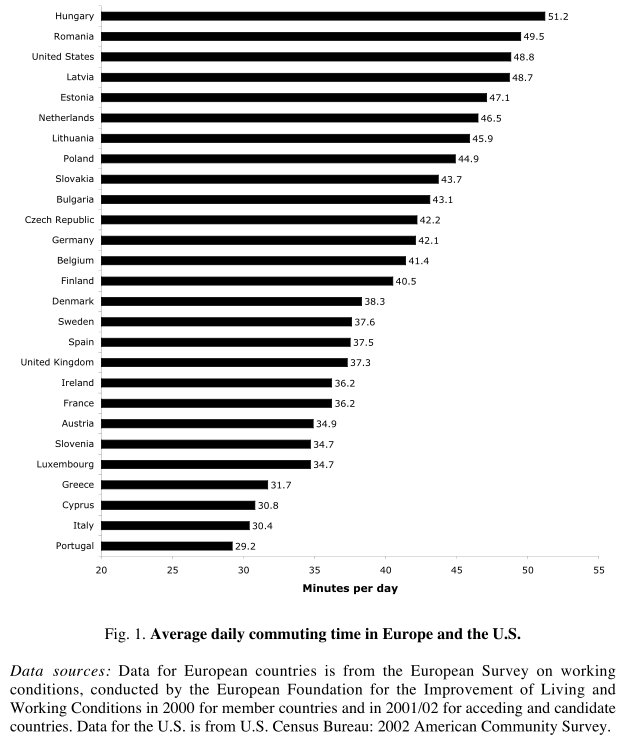
Average daily commuting time in Europe and the U.S.
Below chart is taken from Stress That Doesn't Pay: The Commuting Paradox, August 2004, page 30. The data is per 2000/2001.

The above document links these numbers with reported satisfaction with life -- longer commuting times means less happiness.
Numbers change over time. Five year later the U.S. halved their commuting time. This sparks some questions on the reliability of the data. See chart in Average Daily Commuting Time, European and North American Countries, 2005 (in minutes), data from OECD.

A breakdown according profession can be found in Which Professions Have the Longest Commutes?

Data is from 2014.